
The volume of new subsurface data that is being acquired and made available is rapidly increasing. Meanwhile large digital transformation projects are also unlocking legacy data. Many oil and gas companies are finding themselves with data assets from multiple countries that are being transformed into digital resources that could be used for oil and gas data analytics.
Further complicating the asset trail, some of these companies are still acquiring and merging with other companies, requiring database migrations and strict adherence to data quality standards and protocols.
Data analytics applied within an organization can help management make better decisions in all facets of the oil and gas business, including their subsurface data management practices and priorities. But how can oil and gas companies harness the power of all of that data?
A Hypothetical Situation
Let us introduce you to Zurich Oil and Gas, a fictitious company for the purpose of illustration. Let’s say Zurich is a large multinational oil and gas company with 20,000 plus employees and $30 billion in revenue last year. It has subsurface data assets from 110 plus countries.
Zurich has aggressive growth plans and to that end has acquired three other companies in the last five years, resulting in three database migrations and multiple concurrent project streams.
Massive Digital Transformation
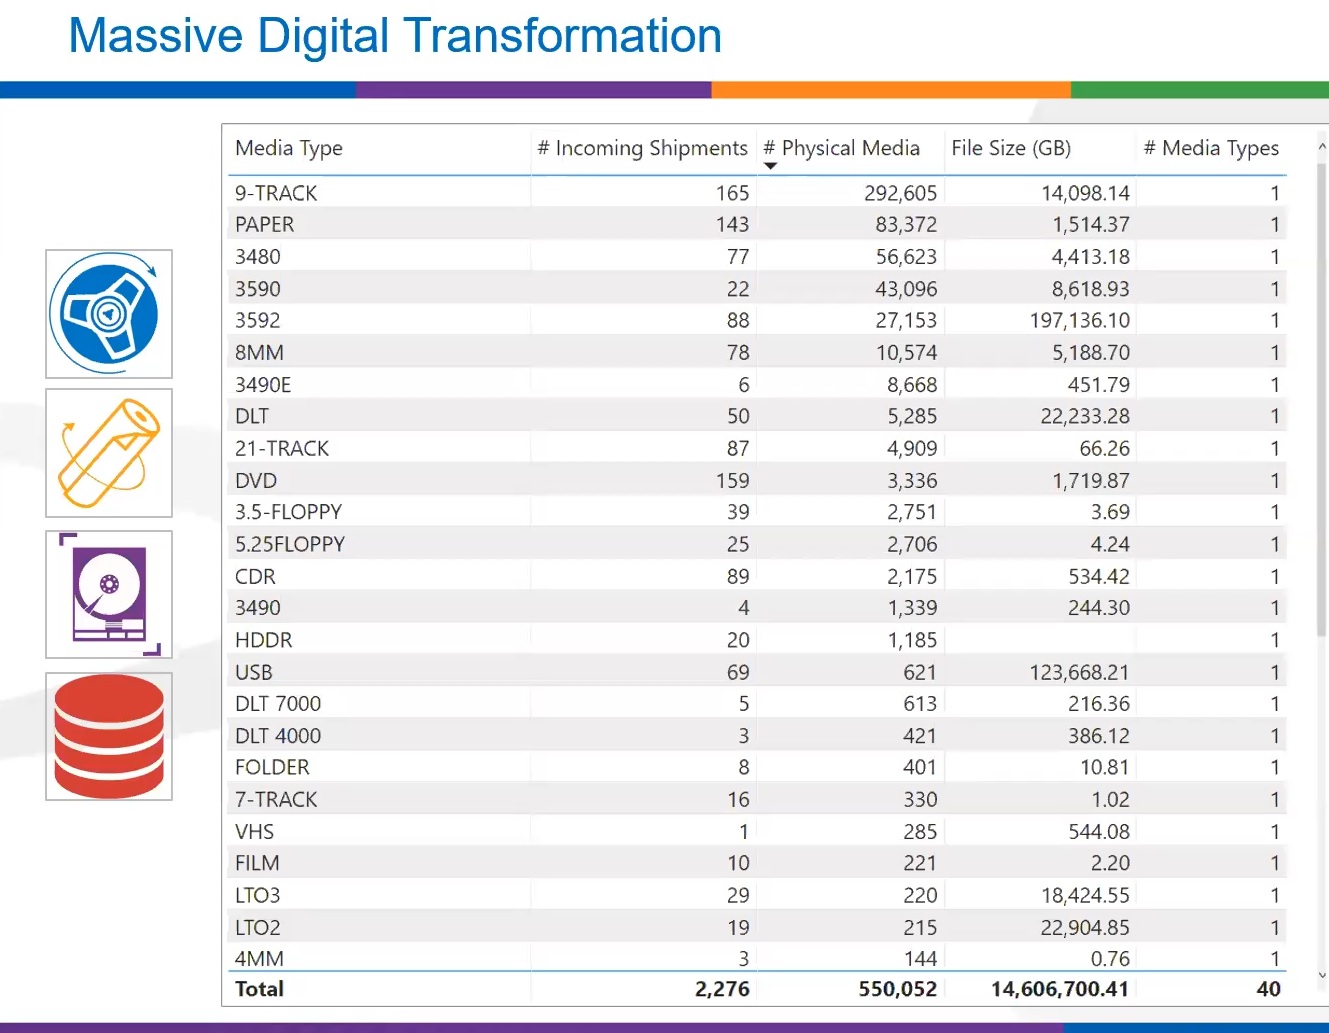
In the process of a strategic digital transformation project, Zurich has made over 2,000 shipments containing over 500,000 distinct physical media items, leading to nearly 15 petabytes of data being loaded into their data management platform. This required the digitizing of 40 different media types from 9-tracks to paper to 3.5 inch floppies and even VHS tapes.
If you were to look year over year, the amount of data loaded each year peaked at about 400,000 files and about 5.5 petabytes.
As a result of committing to the hard work of digitizing the world, data has converged data from far flung disparate and siloed data sources into a single database. They can now rightfully regard the data itself as an important and strategic asset from which value can be harnessed. With their data now in a single central management platform, they are positioned to query upon a system that exposes the totality of their subsurface data in one view.
And that’s great! But the natural question is, what’s next?
Data Analytics
We’ve all heard about the benefits of data analytics, but where do you begin when you’re looking at massive volumes of subsurface data from all over the world? Well, just like with any large undertaking, you break it down into sizeable chunks and prioritize. Zurich identified the following as their key priorities:
- Exploratory Data Analysis (EDA): Obtain a general understanding (a 360-degree view) of what subsurface data assets have been amassed through all these projects. In other words, understand the ’big picture’ of what data has been loaded to date.
- Uncover Insights and Opportunities: Uncover insights and opportunities that lead to prescriptive actions to improve the profitability of their subsurface data assets.
- Map Visibility: Understand and improve map visibility of subsurface assets. Given that most end users start their searches and orders from a map, important inventory that is “not map visible” might remain “dark data” that does not show up in searches by end users. Furthermore, the same navigation coordinates used to add lines and surveys to the map are an important input for reprocessing the data properly in the future. Without these coordinates, the data has no immediate value to geoscientists.
- Entitlements and Ownership: Get entitlements and ownership under control. Proprietary data can be marketed for license or sale, earning revenue rather than simply sitting on the shelf. On the flip side, exposing data for sale that has indeterminate ownership could lead to messy legal issues, so proving entitlement to data is critical.
- Data Completeness: Understand and improve data completeness. You need to have field, navigation and supporting documentation such as observer’s reports in order to reprocess the data. When you have a complete dataset, the value of that data is much higher. On top of that, if you also have a stack available, you might be able to do some preliminary interpretation right away increasing the immediate value of that seismic volume.
- Data Quality: Find metadata gaps and inconsistencies within specific database fields and resolve to improve database organization, searchability and usability.
Map Visibility – Out of Sight, Out of Mind
Map visibility is an important metric to establish database health. Have you ever tried to find an address that does not appear on the map? In the case of subsurface data management within iGlass, if it is not on the map, it can easily slip into obscurity (aka “dark data”).
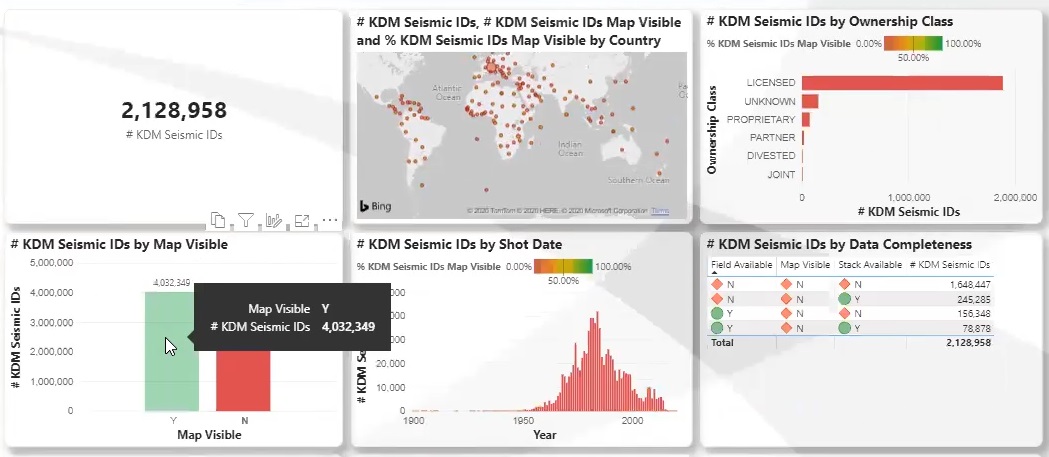
With subsurface data analytics, important metrics like map visibility and ownership can be monitored constantly and in real time, to make sure the database yields maximum benefit. The result is an insightful, compact view of the health of the subsurface database from a map visibility standpoint, from region to region.
Map visibility and ownership are the tip of the iceberg when it comes to the value you can derive from the power of data analytics. The real-time visual reports indicate the health of your subsurface database and empower you to make important business decisions to move your data forward.
360 Analytics – A Complete View of the Subsurface Data Stream
With iGlass as the convergence of massive digital transformation and a need to perform data analytics to extract value, Katalyst has prepared an analytics environment for companies like Zurich Oil.
The platform to be launched this October is Katalyst 360, a self-service analytics environment that gives consumers a 360 degree view of their data. Extract, Transform, Load (ETL) pipelines pull analytics-ready metadata into reports, dashboards and datasets. Users can filter, slice and dice in order to perform various analytics such as understanding status, completeness and/or quality of various processes, projects or data. Users can also build their own reports and dashboards on top of datasets from a blank canvas.
The metadata within iGlass is the starting point, and plans are to further enrich the environment with additional data, including operational data, public data, and predictive and prescriptive analytics. Hands-on workshops and consulting services will be available to help clients use the analytics to understand their data. Finally, Katalyst consultants can create custom analytics solutions.
![]() You Know Subsurface Data, Now You Can Learn From It
You Know Subsurface Data, Now You Can Learn From It
Subsurface data management analytics provide living, breathing reports and dashboards that are synchronized to the refresh of the upstream dataset. Katalyst 360 empowers clients as well as our own internal account managers and consultants with the ability to extract insight from subsurface data assets. We look forward to providing more details when we officially launch the platform in October.
For more information about analytics for data management and the Katalyst 360 platform, please contact us.
Contact Us
Get answers to your questions about oil and gas data analytics. Complete the form below and one of our team members will contact you promptly.